
Why Build a HamSCI-Style Station Around WSPR?
A HamSCI Personal Space Weather Station is best understood as a disciplined amateur-radio receiving and measurement station, not just another digital-mode setup. Instead of asking only, “Can I make the contact?” the station asks, “What is the ionosphere doing, and how can I use that information tomorrow?”
HamSCI’s Personal Space Weather Station work encourages distributed, repeatable measurements by radio amateurs and citizen scientists. The 2026 HamSCI program materials highlight PSWS deployments, WSPR sensing, and an expanded role for volunteer-host stations. That makes this a good time for technically curious operators to turn ordinary WSPR spots, FST4W decodes, and HF Doppler observations into a personal propagation tool.
The goal is not to replace professional space-weather instruments. It is to build a useful home system that helps you recognize band openings, compare antennas, notice disturbances, and contribute cleaner observations when you choose to share data.
What WSPR Spots Can—and Cannot—Tell You
WSPR, the Weak Signal Propagation Reporter mode, is a low-power digital beaconing system used on amateur bands. A typical WSPR transmission carries a call sign, Maidenhead grid, and power level. Receiving stations decode the signal and often upload spots to public databases. For propagation study, each spot is a small data point: frequency, time, path, signal-to-noise ratio, drift, transmitter location, receiver location, and reported power.
That is valuable, but it is not a perfect map of the ionosphere. WSPR data is shaped by who happens to be transmitting, where receivers are located, what antennas they use, receiver noise, local interference, software settings, and whether stations upload spots. A missing spot does not prove that a path was closed. It may only mean nobody transmitted, nobody listened, or the local noise floor was too high.
The trick is to treat WSPR as a long-term sensing network. Single spots are interesting. Patterns are useful. Multi-day comparisons by band, time of day, path length, and direction can become a practical operating aid.
Core Station Architecture
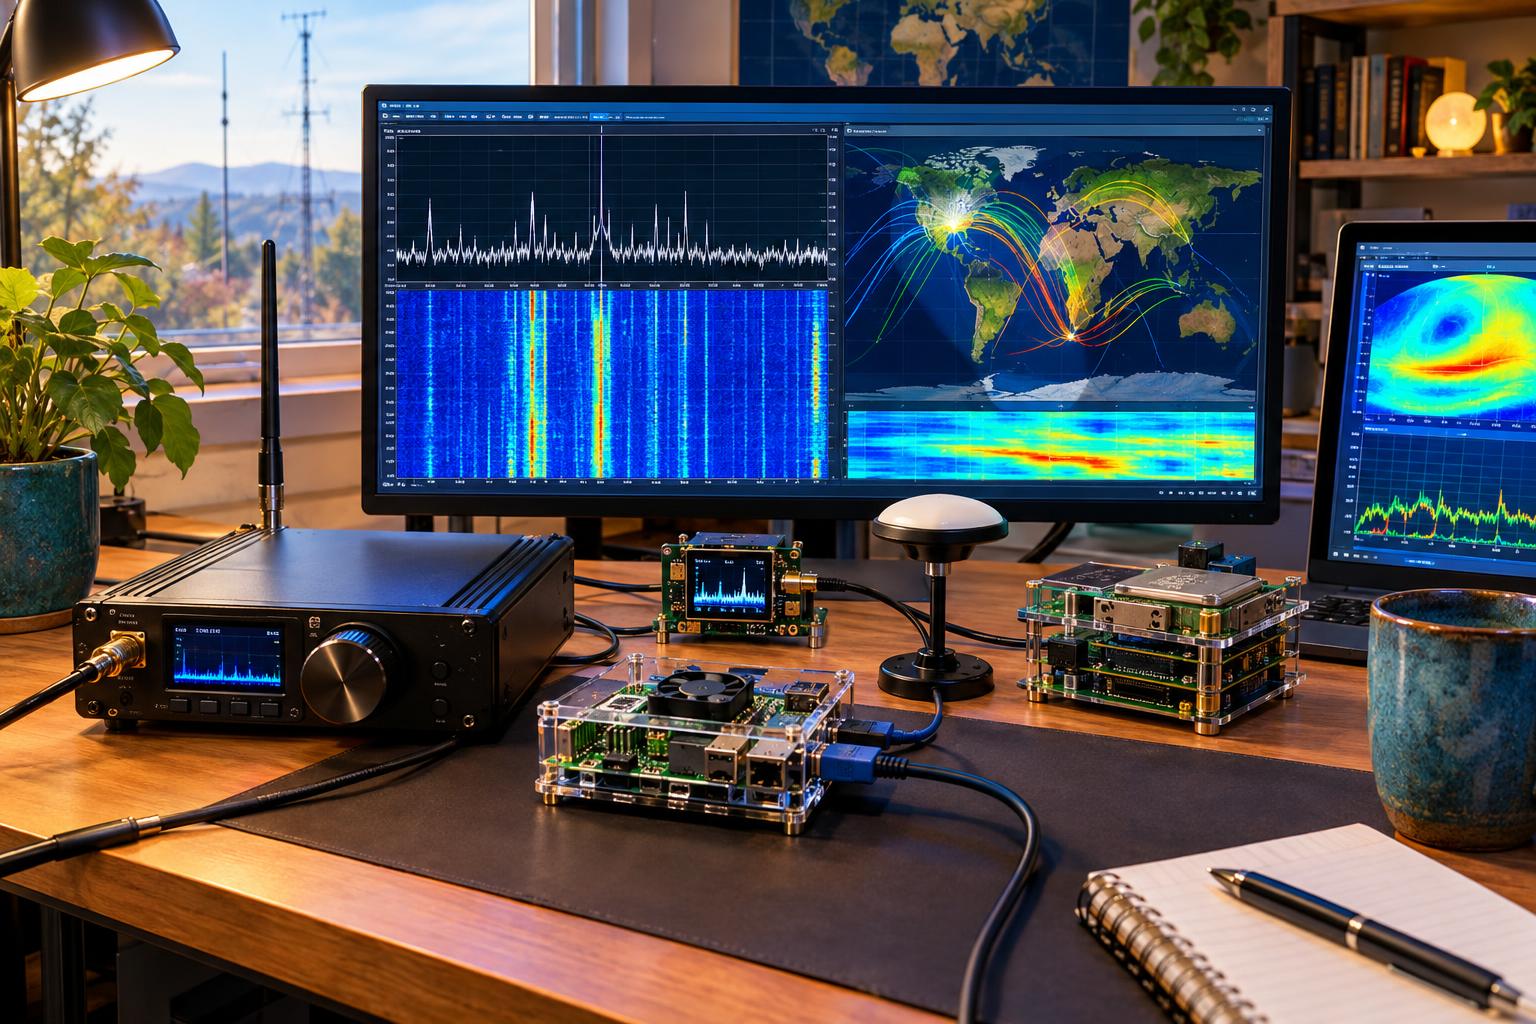
A home station inspired by HamSCI PSWS principles can be built in layers. Start simple and add measurement quality as your interest grows.
Layer 1: Receive-Only WSPR and FST4W Monitoring
The simplest useful station is a stable HF receiver, a modest antenna, a computer, and decoding software. An SDR receiver is convenient because it can cover multiple bands, record spectrum, and feed digital-mode software. A conventional transceiver with audio output also works.
- Receiver: HF SDR or transceiver with reasonably stable frequency control.
- Antenna: End-fed wire, dipole, loop, vertical, or active receive antenna suited to your space and noise environment.
- Computer: Low-power desktop, laptop, or single-board computer with reliable timekeeping.
- Software: WSJT-X for WSPR and FST4W decoding, plus logging or database tools for analysis.
- Time source: Internet time synchronization at minimum; GNSS timing if you later pursue tighter measurements.
FST4W, available in the WSJT-X family of weak-signal modes, is designed for beacon-style propagation work and can be useful where very weak signals and longer transmit/receive cycles are acceptable. As with WSPR, the value increases when your time, frequency, station description, and logging practices are consistent.
Layer 2: Controlled Local Beaconing
If your license privileges, band plan, station design, and local regulations allow it, you can add low-power WSPR or FST4W transmissions. Keep power levels modest, identify properly, follow current band allocations, and avoid creating interference. In the United States, amateur operators must comply with FCC rules, including operating privileges and RF exposure evaluation requirements. Other countries have different rules.
A controlled beacon is especially useful when you want to compare how your signal is heard on different bands across the day. However, transmitting is optional. A receive-only station can still teach you a great deal.
Layer 3: HF Doppler Monitoring
HF Doppler monitoring looks for tiny frequency shifts in stable signals after they reflect or refract through the ionosphere. These shifts can be associated with changing ionospheric conditions, traveling ionospheric disturbances, sunrise and sunset transitions, geomagnetic activity, and other effects. HamSCI PSWS-related work has emphasized repeatable observations of signals such as standard-frequency transmissions and other stable sources where appropriate.
For useful Doppler work, receiver stability matters more than raw sensitivity. A receiver locked to a GPS-disciplined oscillator or another stable reference is far better than a free-running receiver for small shift measurements. You do not need to start there, but it is the direction to aim if Doppler analysis becomes serious.
A Practical Starter Build
Here is a realistic first version for a US amateur operator who wants useful data without building a laboratory-grade system on day one.
- Antenna: 40–80 ft wire outdoors if possible, with appropriate matching and common-mode choking; or a small receive loop if local noise is severe.
- Receiver: HF-capable SDR with adequate dynamic range for your RF environment.
- Computer: Always-on mini PC or laptop with stable networking and automatic time synchronization.
- Software: WSJT-X for WSPR/FST4W, optional SDR spectrum software, and a spreadsheet or database for summaries.
- Logging fields: UTC time, band, mode, decoded call, grid, SNR, drift, frequency, antenna, receiver, noise notes, and any station changes.
- Data routine: Review daily plots by UTC hour and band; review weekly path maps and SNR trends.
This setup is enough to answer questions such as: When does 20 meters open from my location? Does 30 meters stay useful after local sunset? Is my receive noise worse on weekdays? Does my new antenna increase spot counts broadly, or only in one direction?
Turning Spots Into Decisions
The practical value comes from converting decodes into operating decisions. Do not chase every individual spot. Instead, build simple comparisons.
Band-by-Hour Matrix
For each band, count unique stations heard per UTC hour. After two or three weeks, patterns emerge. You may find that 17 meters opens briefly around local morning, 20 meters carries midday paths, and 40 meters becomes dependable after sunset. This matrix becomes your personal band-opening calendar.
Path Direction Review
Group spots by general direction from your grid: northeast, southeast, southwest, northwest, and long-path possibilities. A wire antenna may favor certain headings. A loop may null local noise but reduce some desired paths. When the same band repeatedly favors one direction at a certain hour, you have actionable information for DXing, POTA hunting, or scheduled QSOs.
SNR Trend Instead of Spot Count Alone
Spot counts are affected by activity. Signal-to-noise trends add another dimension. If several distant transmitters show stronger SNR at similar times on the same band, the band may genuinely be improving. If spot counts fall but your noise floor also rises, the problem may be local interference rather than propagation.
Adding HF Doppler as a Second Sensor
WSPR and FST4W tell you whether weak signals were decoded. HF Doppler monitoring can show that the propagation medium itself is moving or changing. This is where your station begins to look more like a personal space-weather instrument.
A beginner-friendly approach is to dedicate one SDR channel or receiver profile to a stable HF signal and watch frequency offset over time. Use the most stable frequency reference you can. Record UTC time, nominal frequency, measured offset, receiver configuration, and notes about local equipment changes. Do not overinterpret every wiggle. Look for repeatable features around sunrise, sunset, solar events, geomagnetic disturbances, and regional comparisons if other stations are sharing similar observations.
When Doppler traces change at the same time your WSPR paths fade, shift band preference, or show abnormal SNR, you have a richer picture than spots alone can provide.
Noise Control: The Hidden Success Factor
Many home stations fail as propagation sensors because they are really measuring local noise. Before blaming the ionosphere, reduce preventable interference.
- Run the receiver from a clean power supply or battery during tests.
- Use ferrite chokes on USB, Ethernet, power, and feed-line paths.
- Separate receive antennas from household electronics when possible.
- Document when solar inverters, chargers, LED lighting, HVAC equipment, or computers are operating.
- Compare day and night noise floors on quiet frequencies.
Good notes are as important as good hardware. If you change the antenna, add a preamp, move the feed line, update software, or relocate the receiver, mark the date. Otherwise, you may mistake a station change for a space-weather event.
Safety and Regulatory Caveats
Receive-only monitoring is usually straightforward, but antennas still create real safety issues. Keep wires clear of power lines. Use proper strain relief, weatherproofing, grounding and bonding practices appropriate to your installation, and lightning protection where outdoor antennas enter a building. Disconnect antennas during storms when appropriate, and follow electrical codes and local requirements.
If you transmit WSPR or FST4W, operate only within your license privileges and current band allocations. Use clean signals, appropriate duty cycles, and conservative power. In the US, review FCC amateur rules and RF exposure obligations. Technical capability does not automatically mean legal permission.
Example Workflow: From Raw Spots to a Propagation Note
Suppose your station in the central United States monitors 40, 30, 20, and 17 meters for several weeks. You notice that 20 meters usually produces strong morning and afternoon spots, but on one day the count drops sharply after 1700 UTC. At the same time, 30 meters remains active, 40 meters is normal after sunset, and your local noise notes show no equipment changes. Your Doppler trace also shows unusual movement near the same period.
You should not claim a specific cause from that alone. But you can write a useful station note: “On this date, 20-meter WSPR reception from this location declined after 1700 UTC compared with the prior week; 30 and 40 meters remained comparatively usable; no local station changes were recorded; HF Doppler monitoring showed concurrent variation.” That is honest, searchable, and useful for your future operating decisions.
How to Make Your Data More Useful
- Use UTC everywhere. Local time creates confusion when comparing with other stations.
- Keep station metadata current. Antenna type, height, receiver, frequency reference, and grid square matter.
- Avoid constant tinkering. Stability makes trends easier to trust.
- Separate experiments. Change one major variable at a time when comparing antennas or receivers.
- Archive raw data. Summaries are helpful, but raw decodes allow better analysis later.
- Label estimates clearly. Do not turn rough observations into precise claims.
Frequently Asked Questions
Do I need an expensive station to start?
No. A modest SDR, a usable antenna, stable time synchronization, and disciplined logging can produce useful personal propagation information. Higher-grade frequency references and receivers become more important when you pursue HF Doppler measurements or multi-band precision work.
Is WSPR better than FST4W?
They are different tools. WSPR has a large established user base and spot ecosystem. FST4W is useful for weak-signal beacon-style propagation experiments and offers options that may suit certain paths and time intervals. Many experimenters can benefit from understanding both.
Can I predict DX openings from my own spots?
You can improve your odds of choosing the right band and time, but you cannot guarantee a contact. Propagation is variable, and WSPR activity patterns are not the same as actual on-air activity for voice, CW, or other digital modes.
Should I upload spots?
Uploading can help the broader amateur and research community, but only if your station time, frequency, and metadata are reasonably accurate. If you are experimenting with unstable settings, keep local logs until the system is behaving consistently.
Key Takeaways
- A HamSCI-style home station turns casual decodes into repeatable propagation observations.
- WSPR provides broad, practical path data, but it must be interpreted with awareness of activity and station bias.
- FST4W adds another weak-signal beaconing option for structured experiments.
- HF Doppler monitoring can reveal ionospheric motion and change when paired with a stable receiver reference.
- Station notes, UTC logging, noise control, and consistent configuration are what make the data valuable.
Legitimate Resources
- HamSCI Personal Space Weather Station project
- HamSCI PSWS documentation overview
- HamSCI 2026 program information
- ARRL report on the HamSCI 2026 Workshop
A home propagation station does not have to be elaborate to be meaningful. Start with clean receive data, build repeatable habits, add timing and Doppler capability when ready, and let your own station history guide your operating choices. That is where WSPR spots become more than dots on a map—they become a personal view of the ionosphere over your own antennas.